Forge

Know where
your estate breaks.
Before it does.

Forge builds a dependency-aware digital twin of your estate, finds the single points of failure and concentration risk hiding in it, and hands back a ranked plan of what to fix first. In hours, not months.

7resilience dimensions
155+deterministic checks
weeks → hoursto a baseline
0agents installed
Scroll

Your resilience is spread across many tools. None of them see the whole chain. Each platform reports its own slice. Nothing joins them into a single view of what a failure would actually cost the business.

The dependency that takes you down isn't on anyone's list. It is a shared component three hops from the journey it kills. No single team owns the whole chain.

A manual review takes months. The estate changes weekly. By the time the report lands, it describes an estate you no longer run.

So you invest in what you already know. And the blind spots stay blind, until one of them finds you at 03:00.

Introducing Forge

One digital twin of your estate.
Every dependency. Every failure path.

Forge joins the feeds you already have into a dependency-aware digital twin, then scores it deterministically across seven dimensions. It shows how far each failure spreads, and where the estate has no way around it.

155+deterministic checks
18analysis quests
Opt-infrontier AI capabilities

No model guessing. No black box. Every number traces to a system, a field and a threshold, so it holds up in front of a regulator.

The proof

One estate. Many ways to interrogate it.
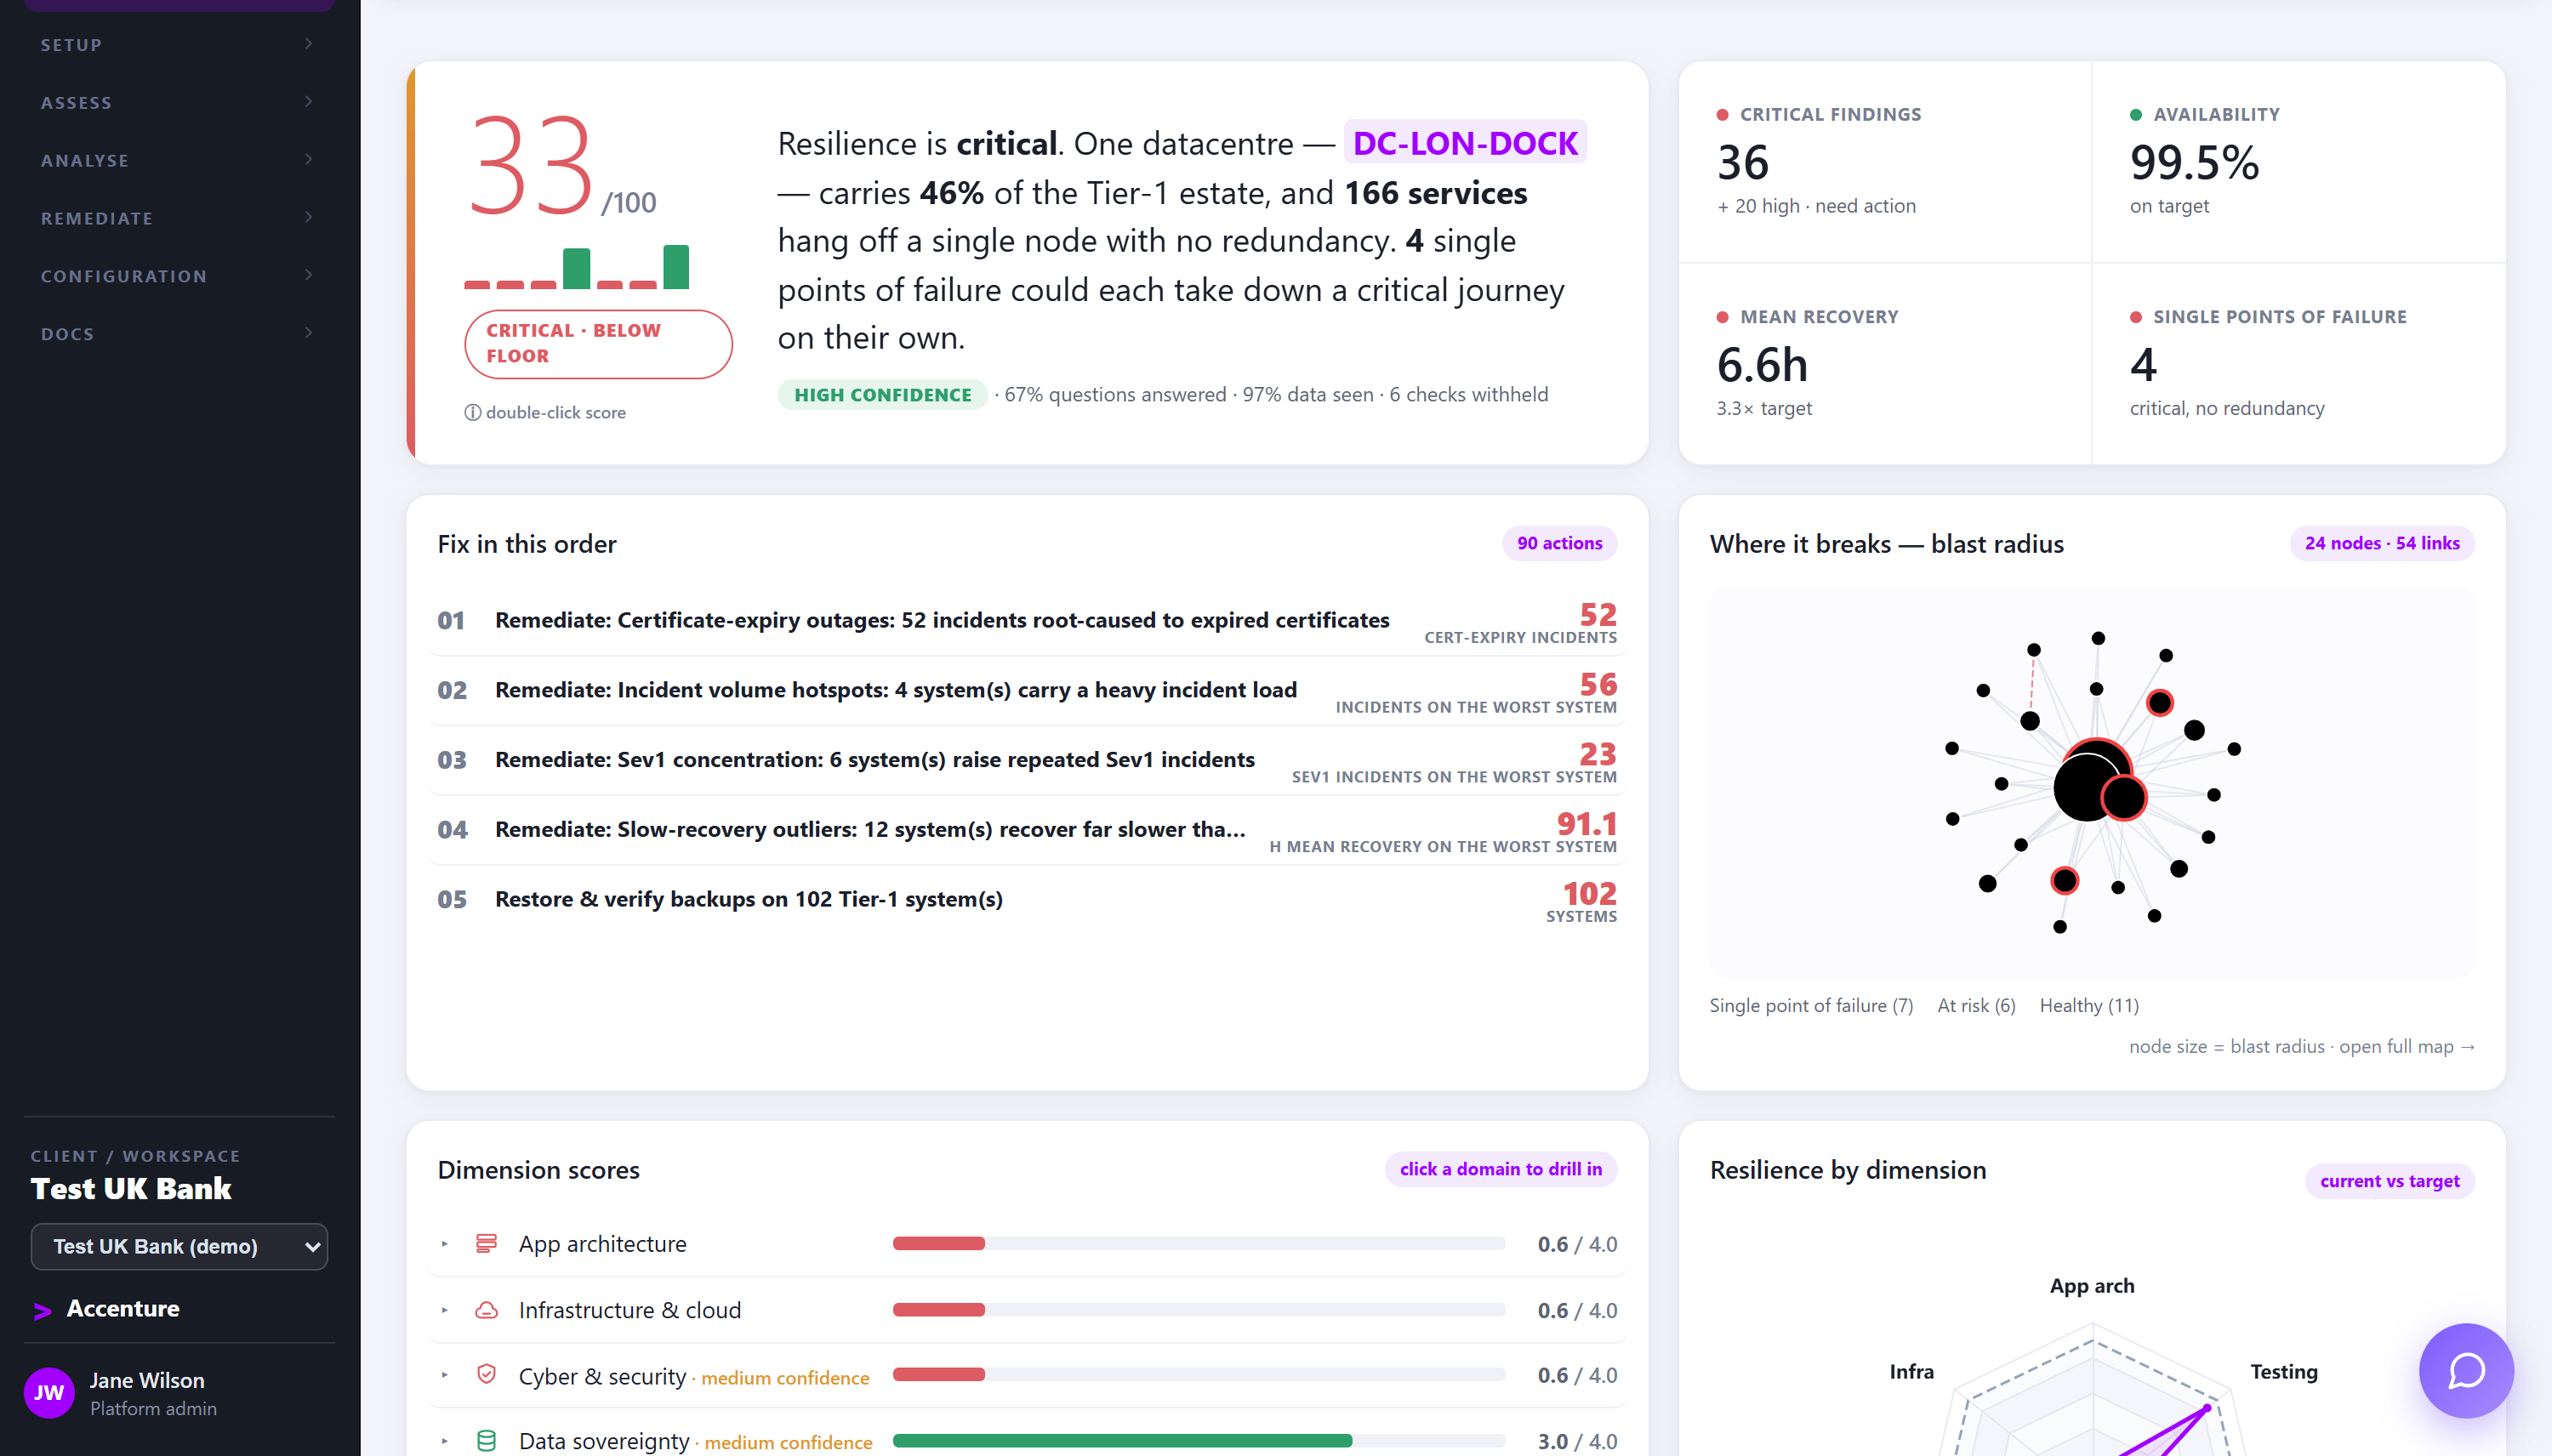
forge — resilience assessment
Forge dashboard: a resilience score of 33 out of 100 marked critical, a plain-English verdict, a ranked fix queue and resilience by dimension.
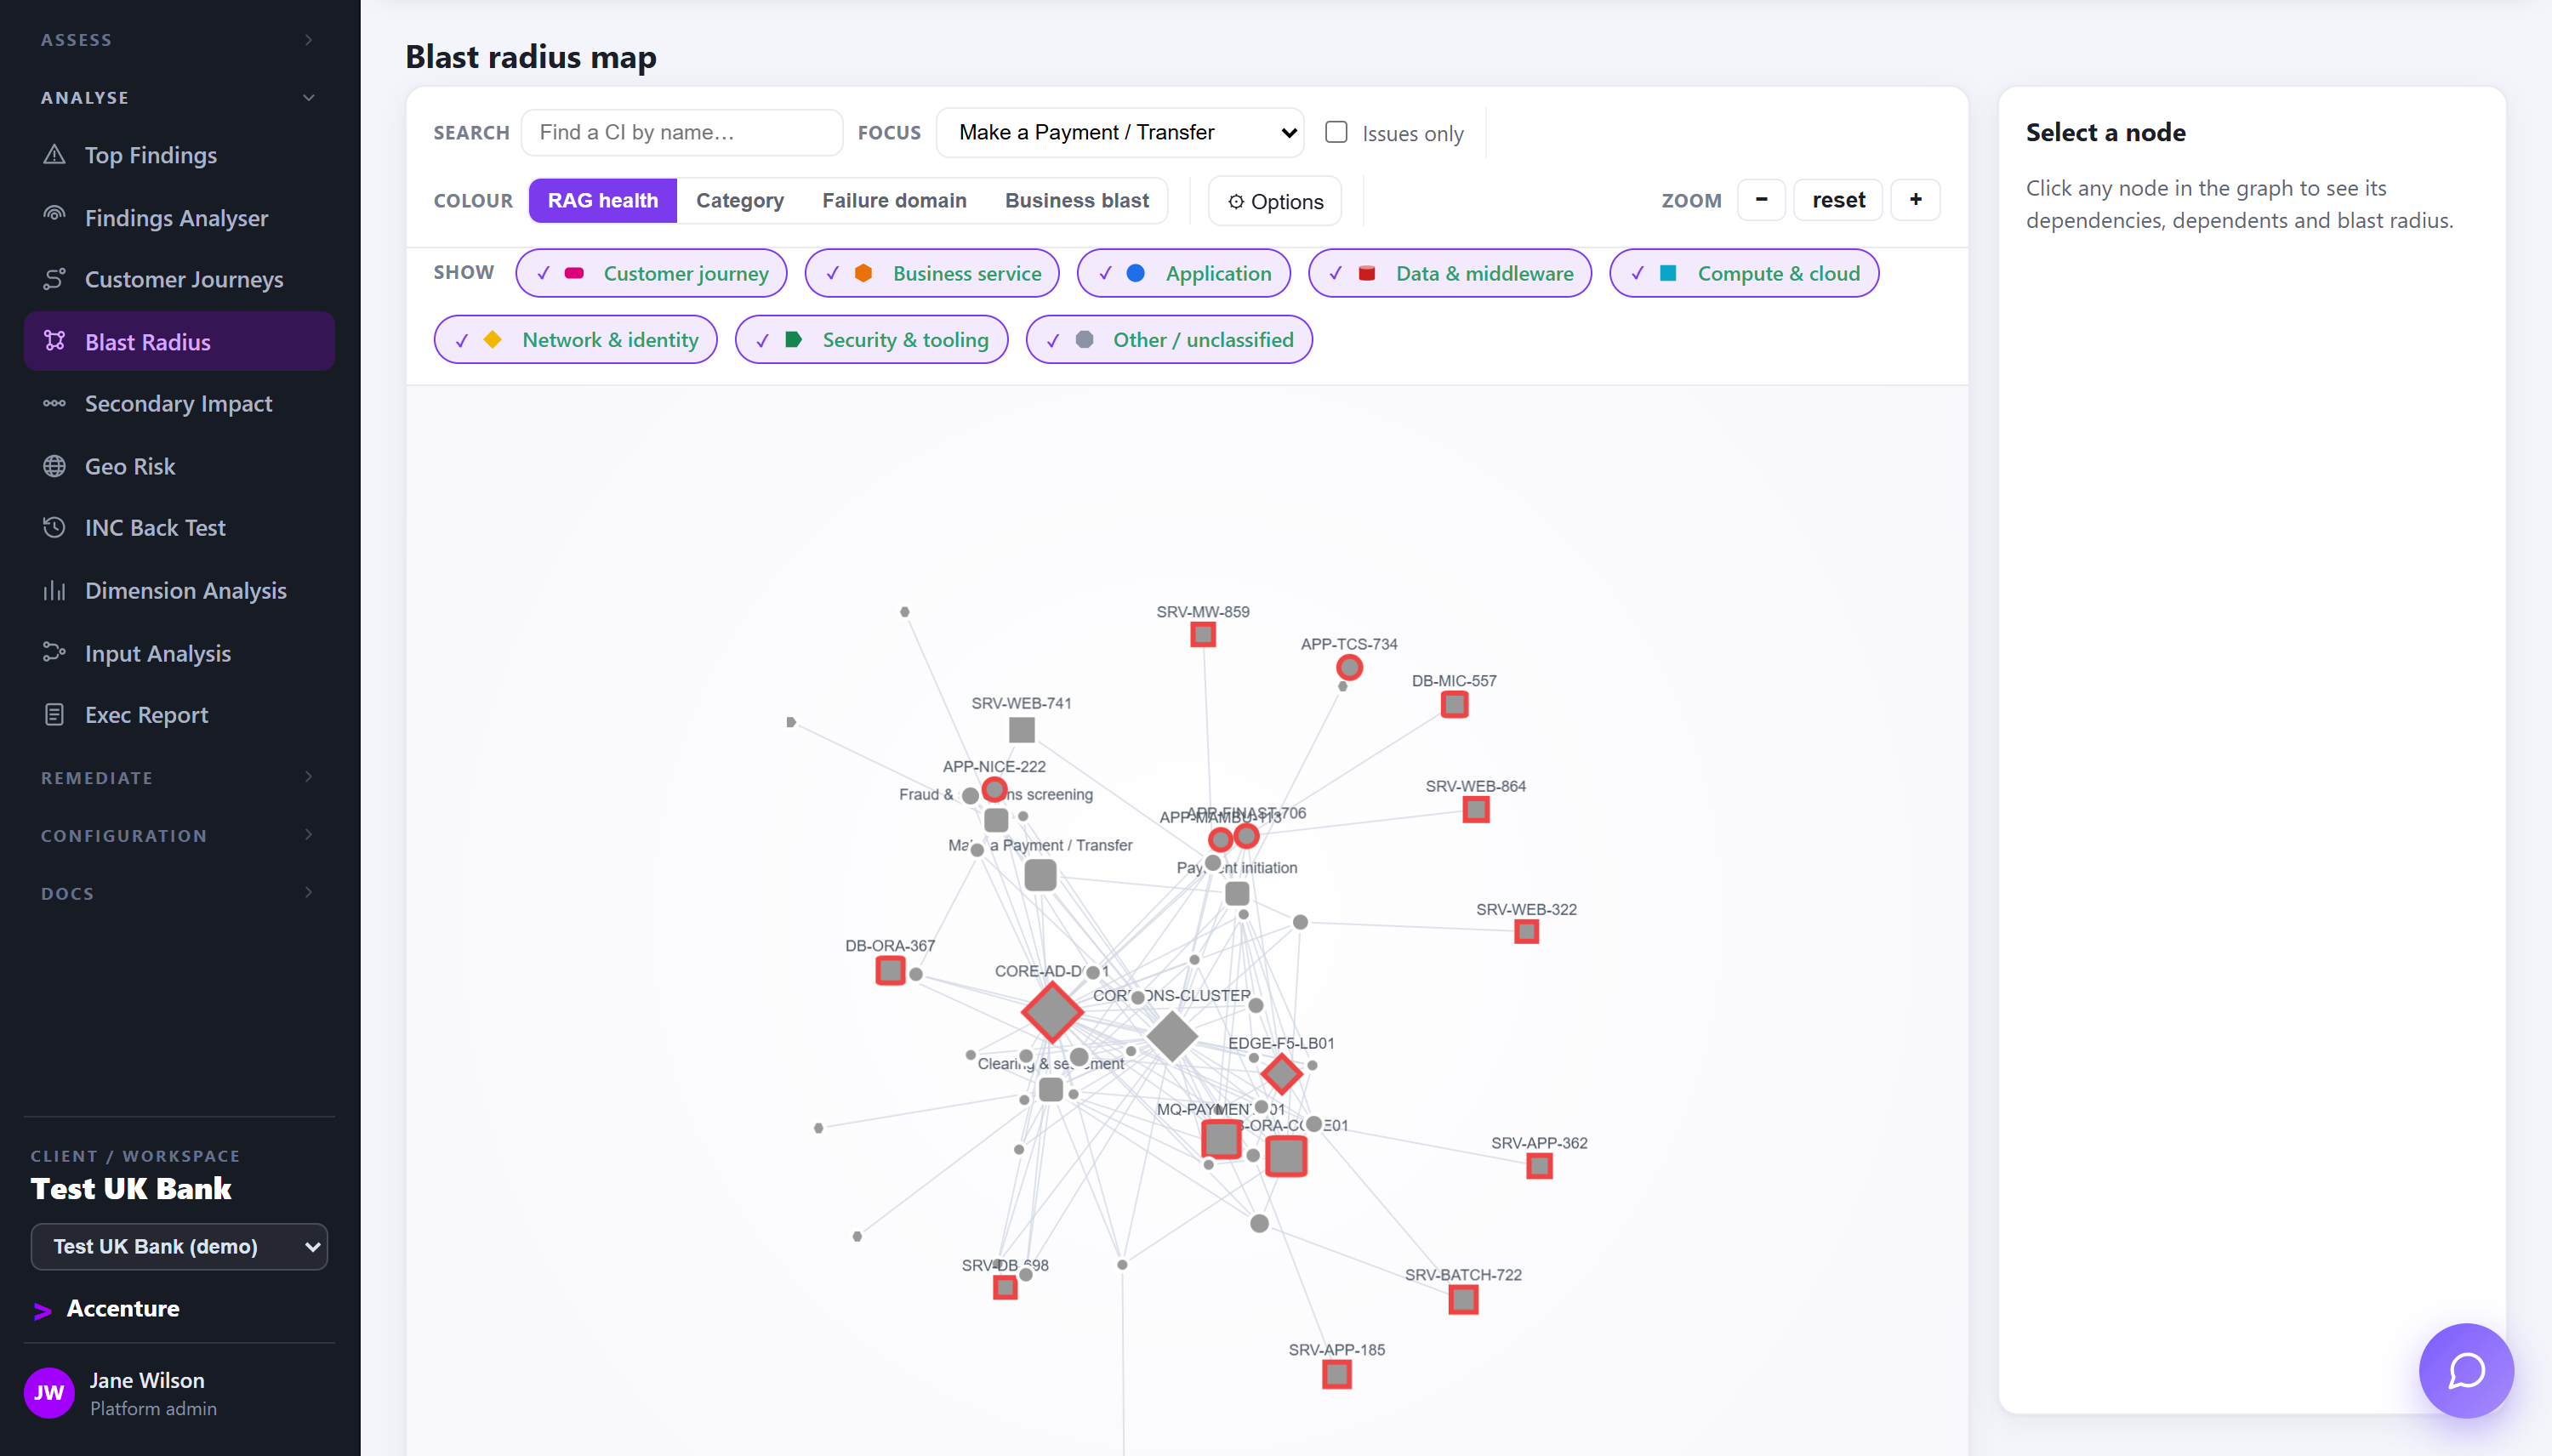
Blast radius map: the dependency graph with single points of failure ringed in red and node size showing blast radius.
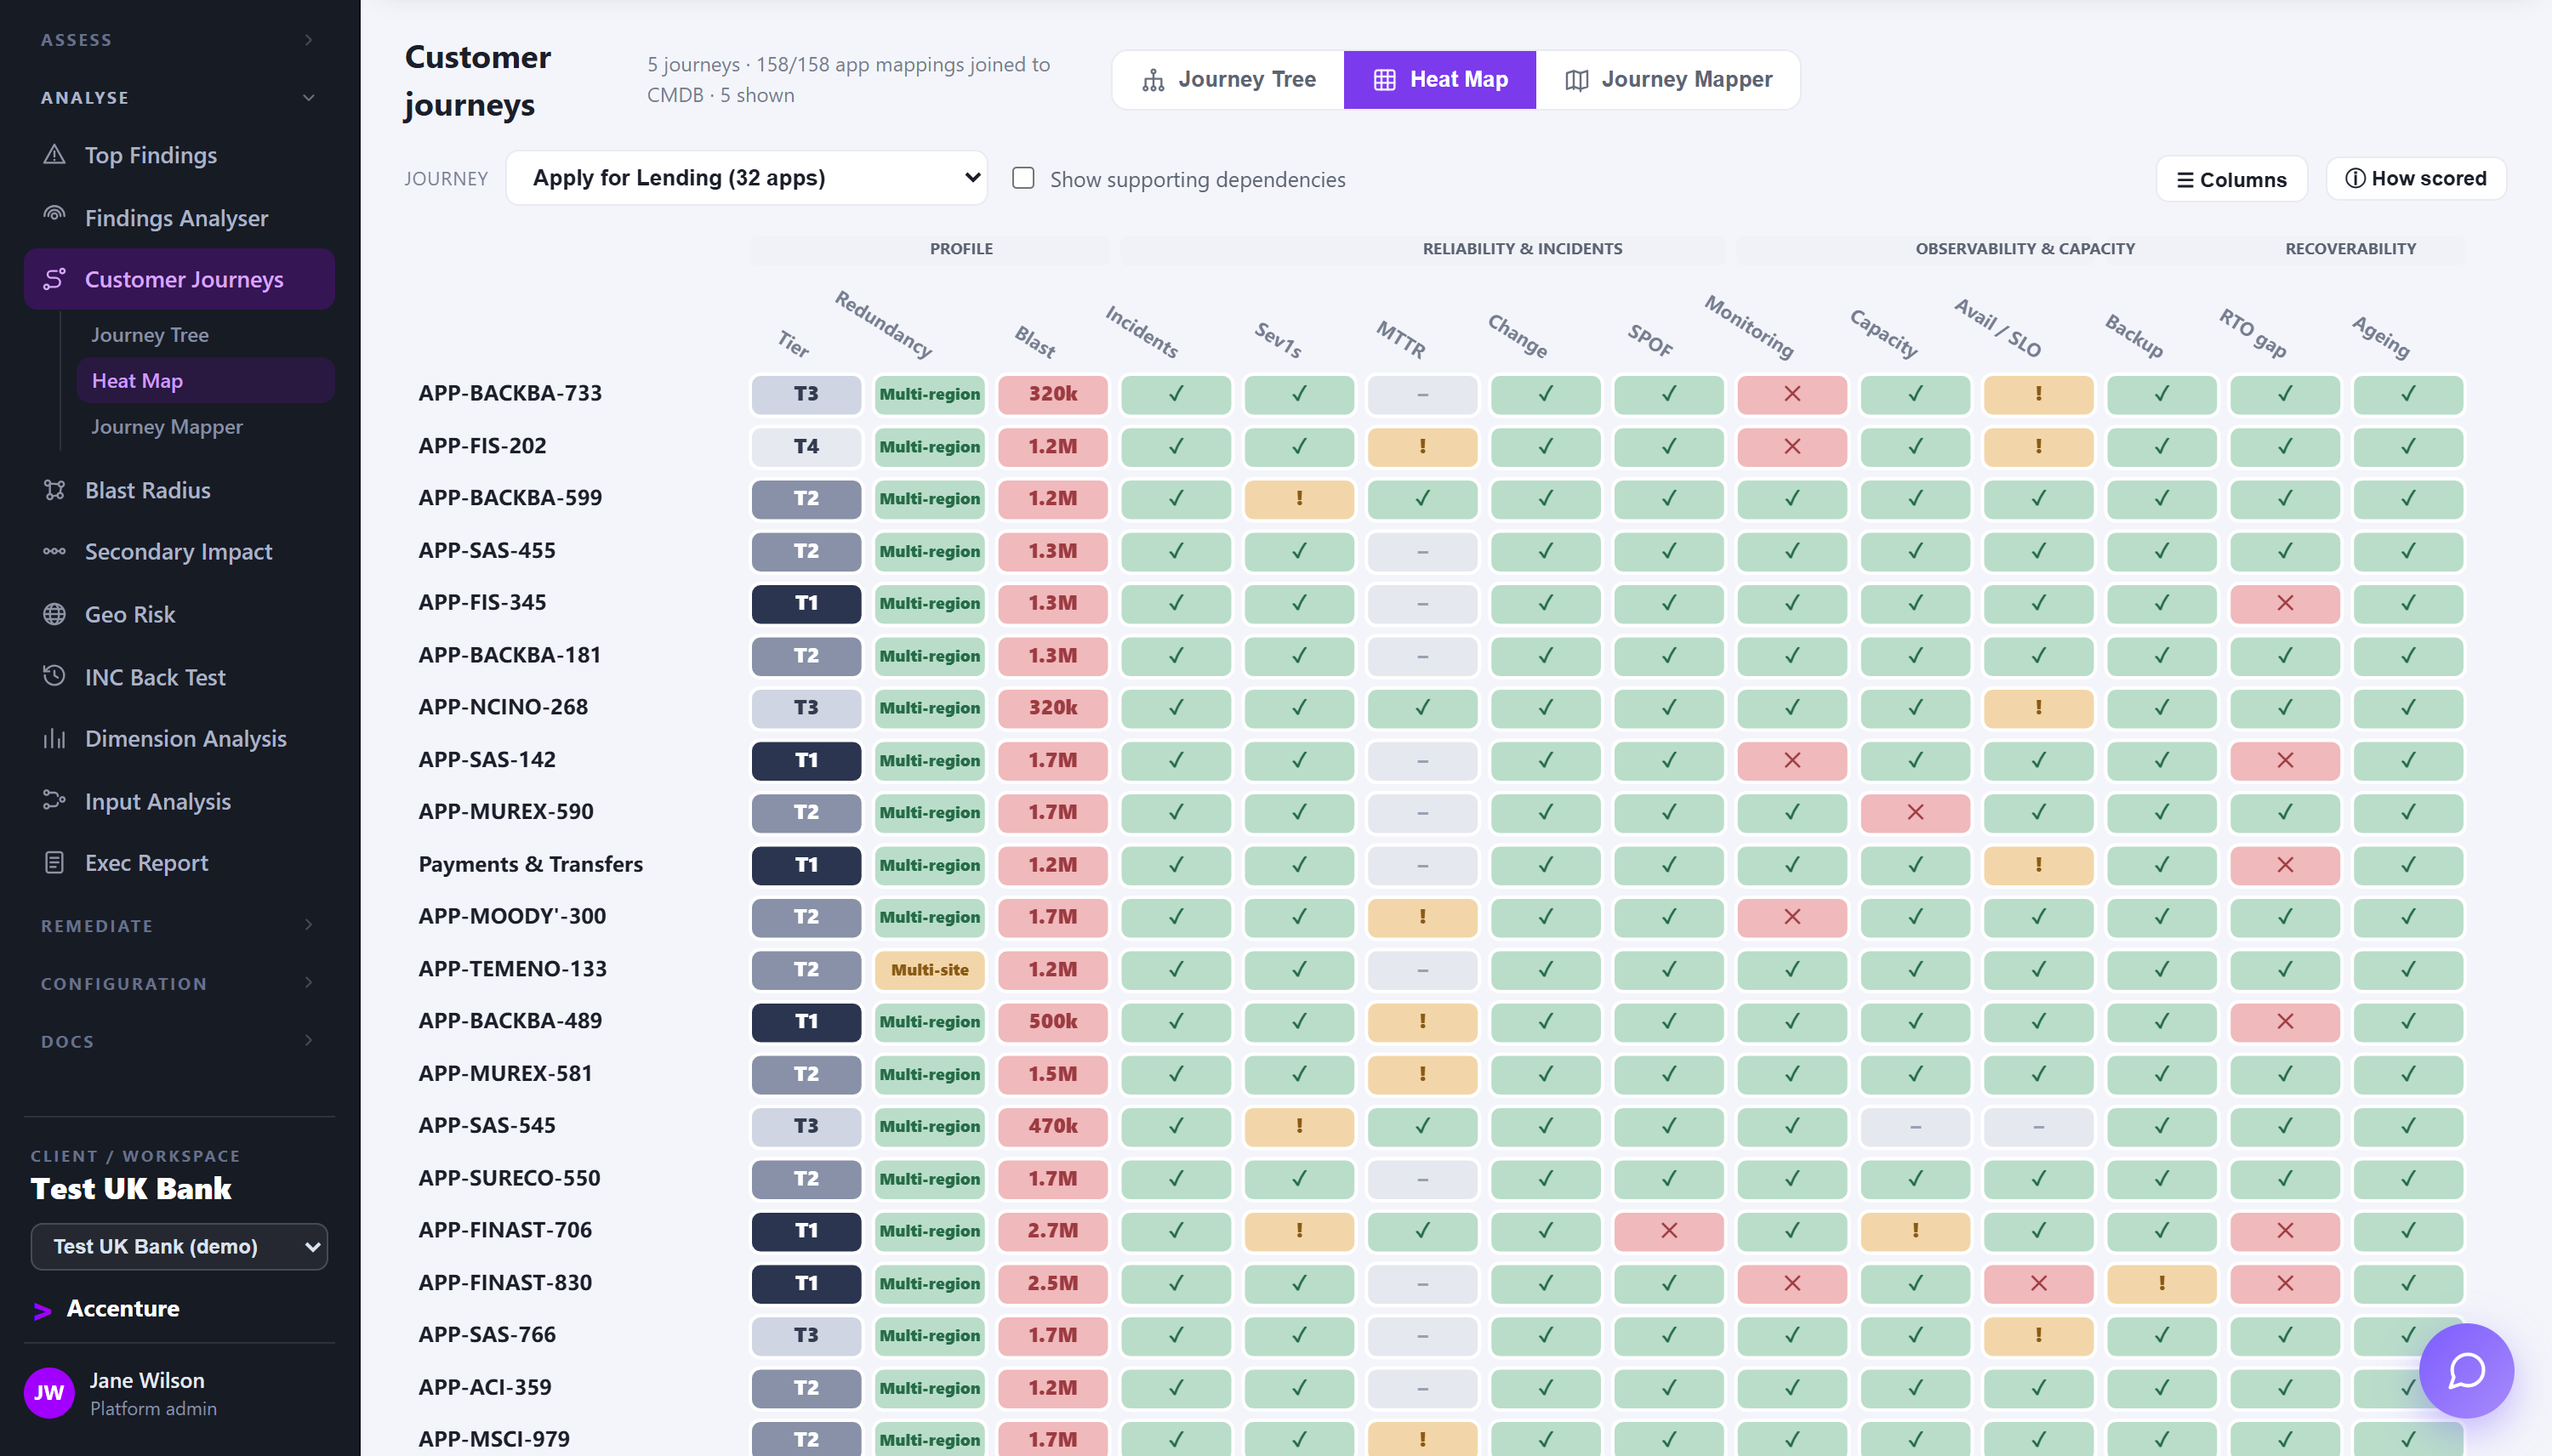
Customer journey heat map: every application behind a lending journey scored across fourteen resilience columns.
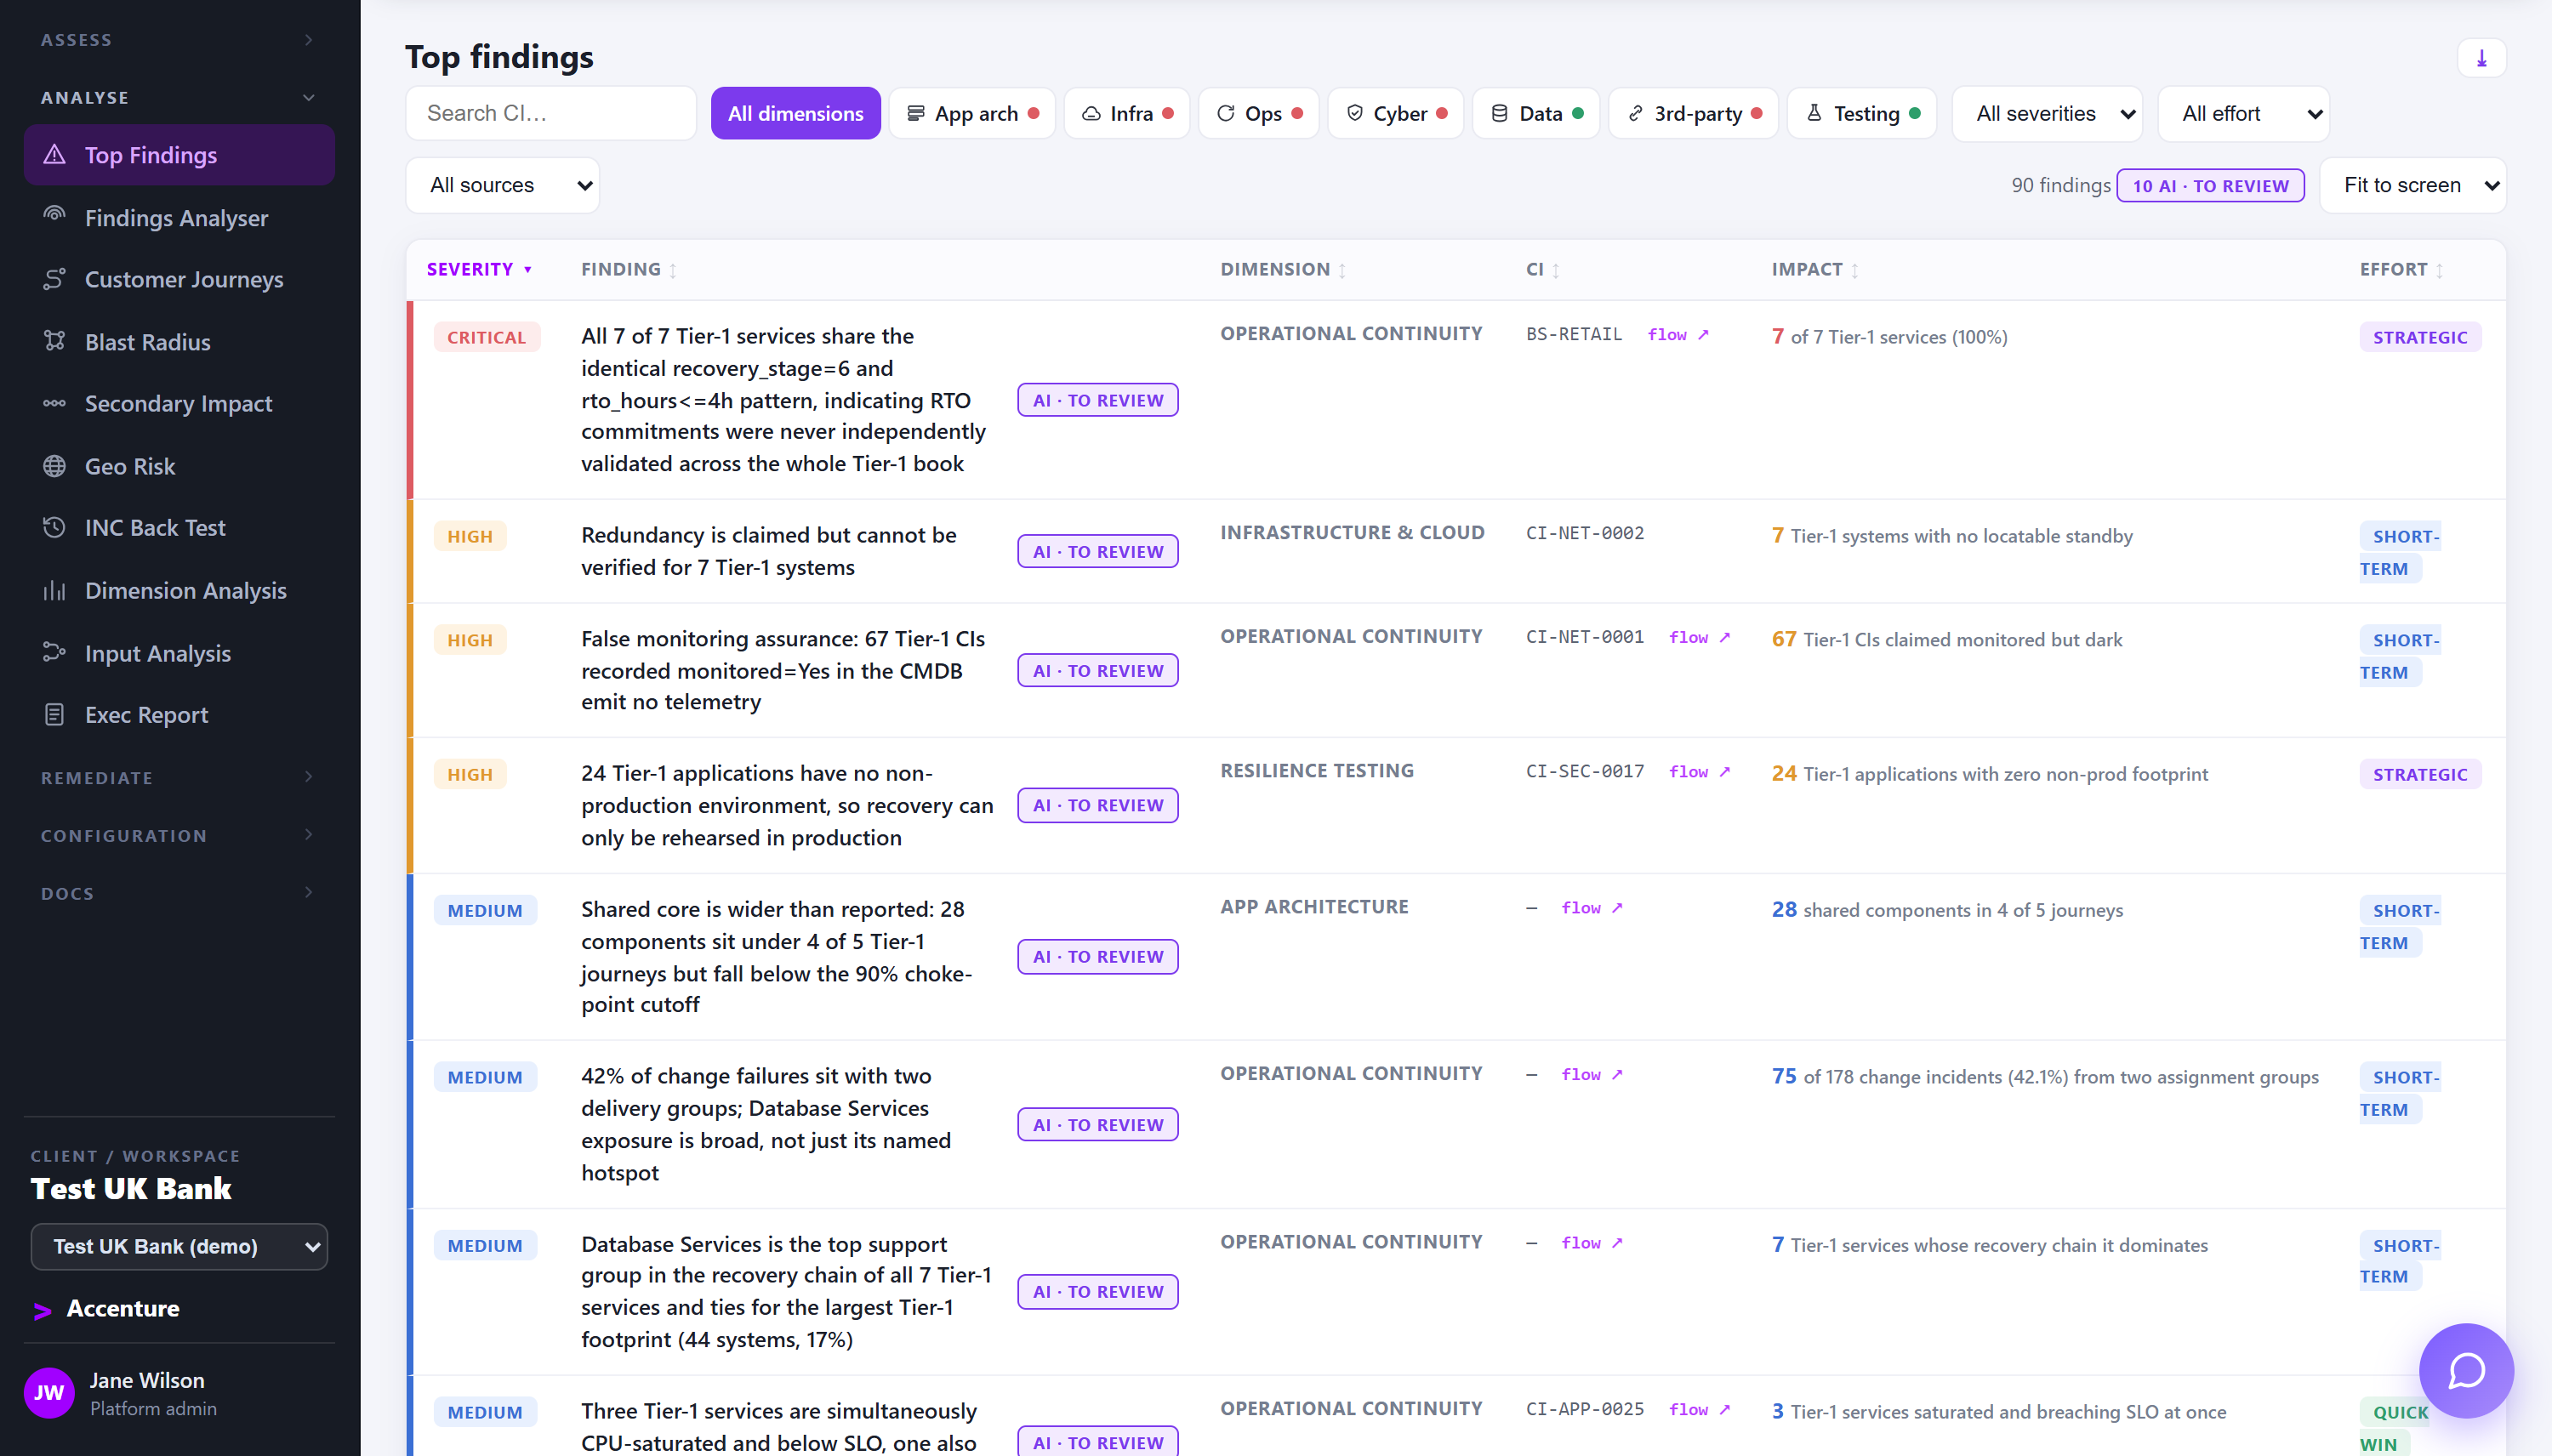
Top findings: a risk-ranked list of resilience findings filtered by severity, dimension and effort.
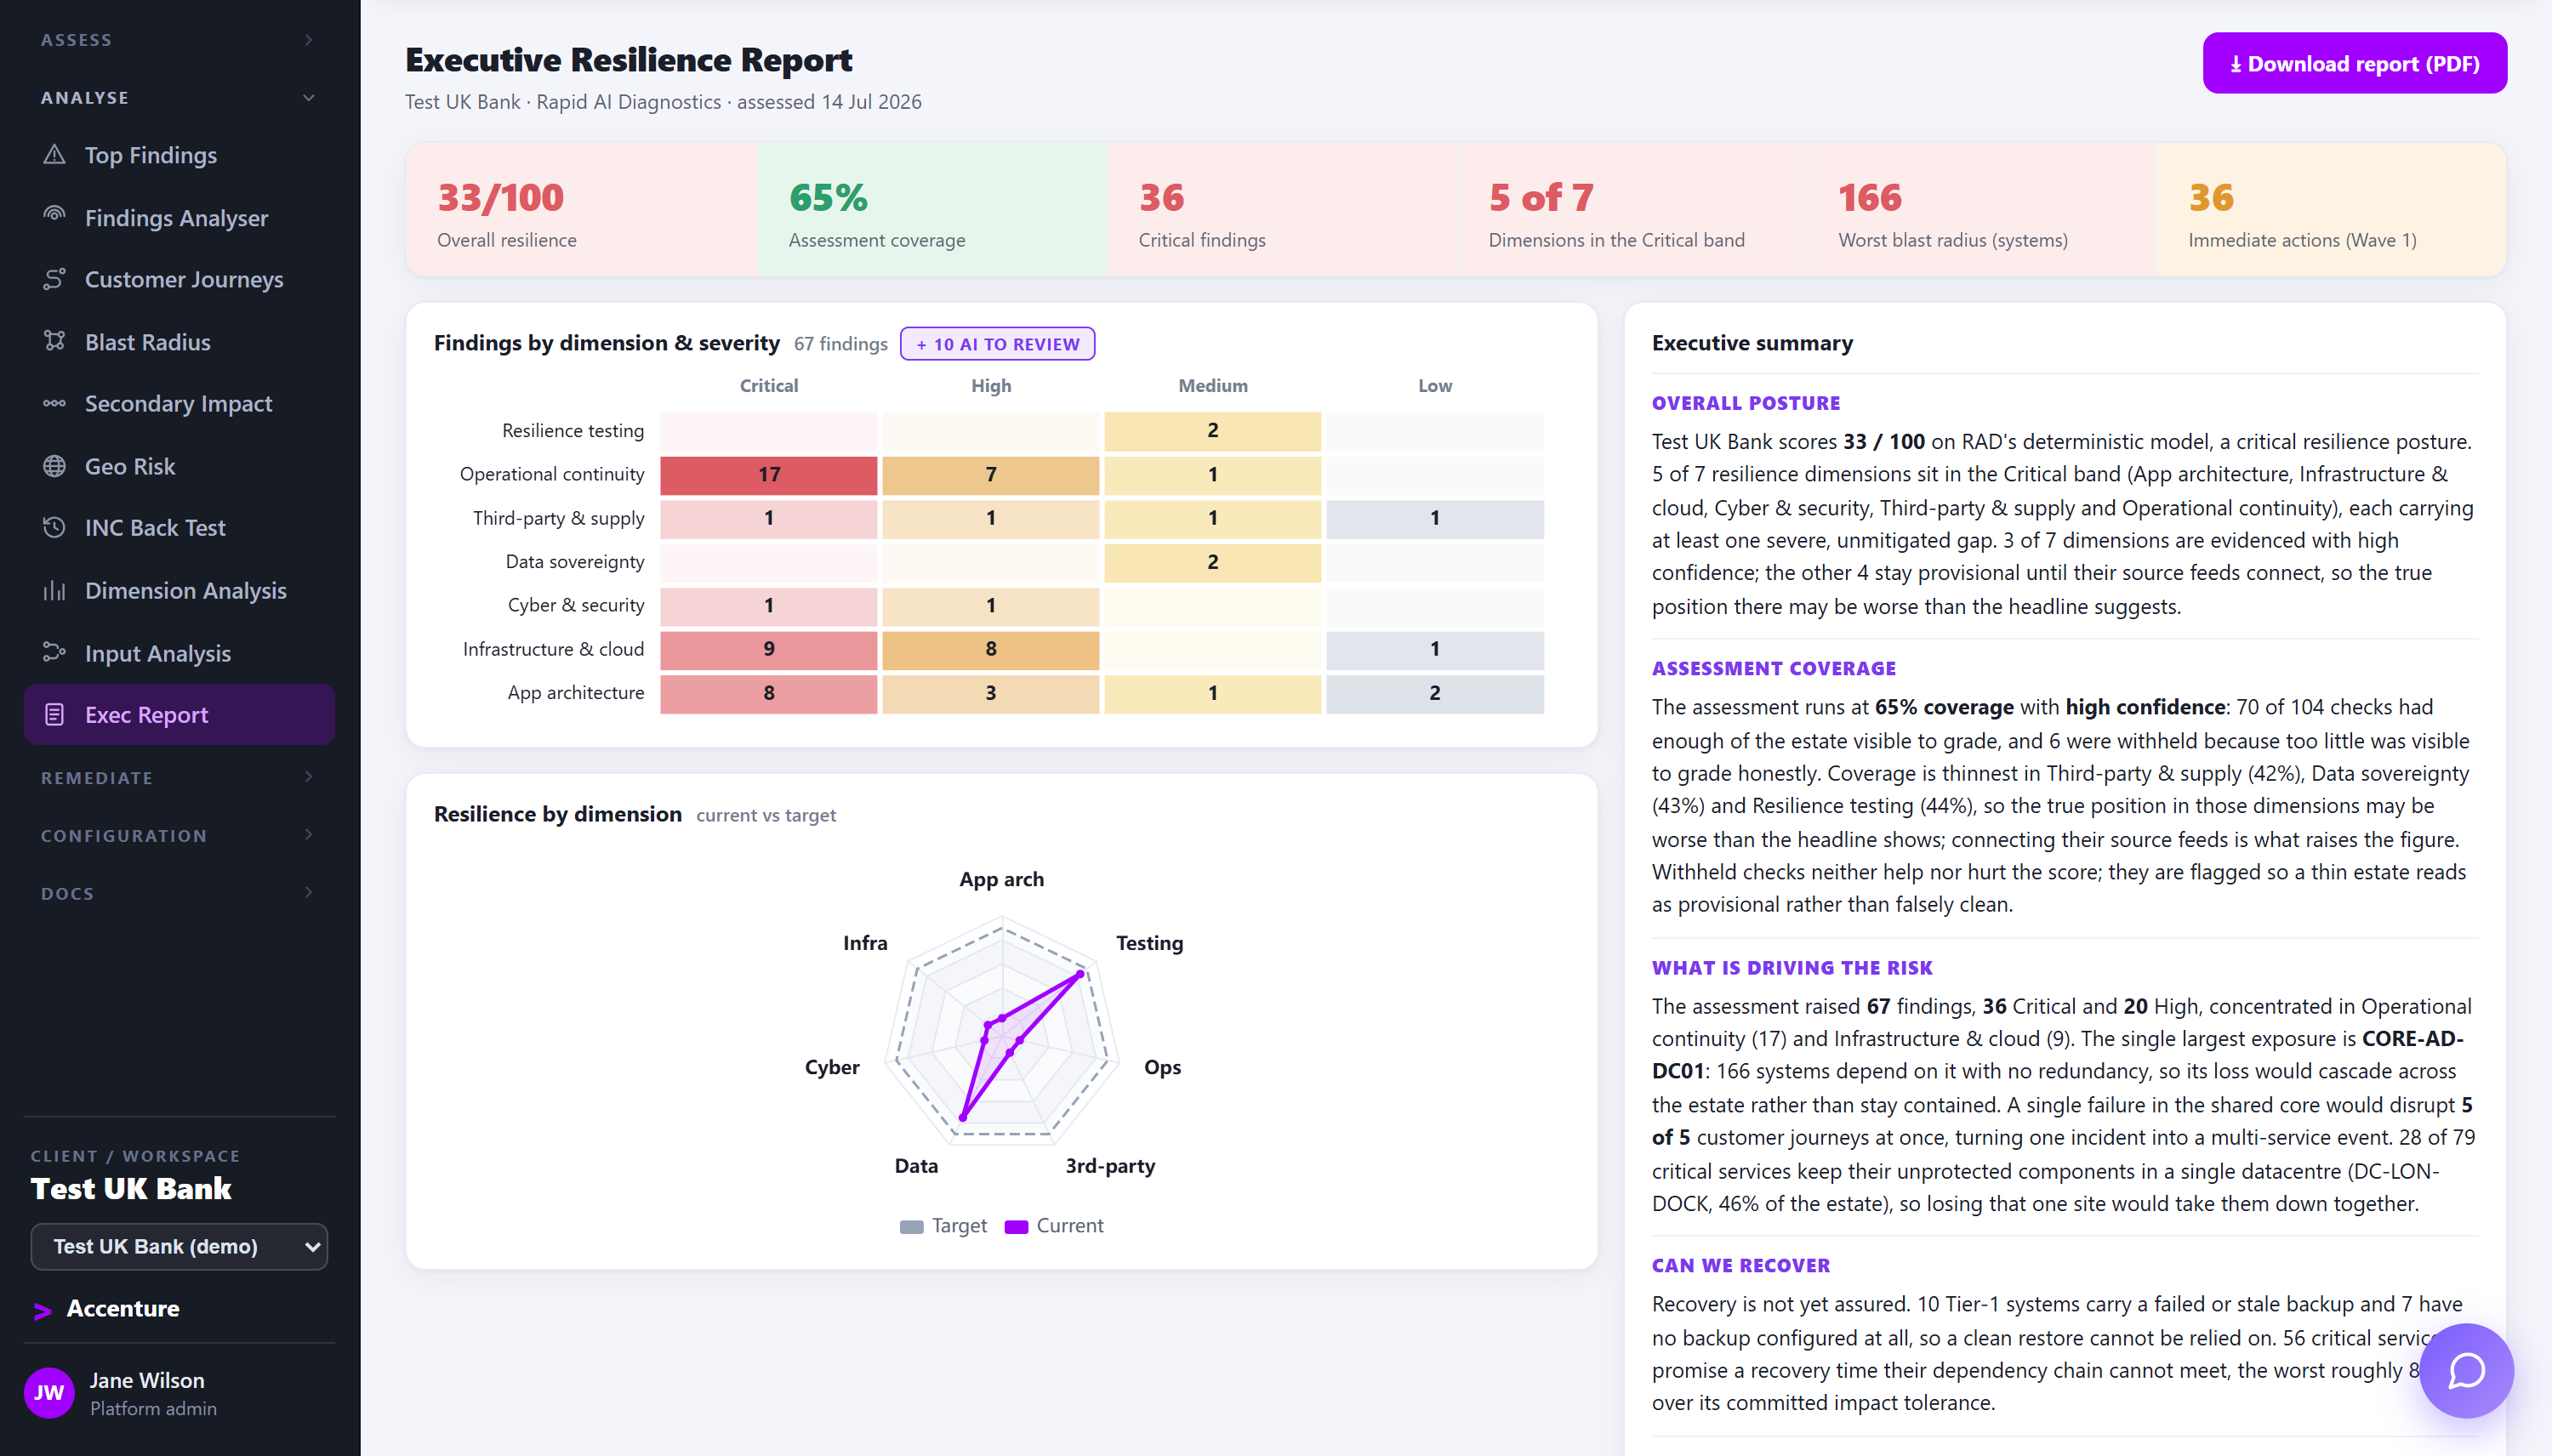
Executive resilience report: headline score, KPIs and resilience by dimension, ready to download as a PDF.
The headline, and what to fix firstOne score, the plain-English reason behind it, and a queue ordered by risk rather than by whoever shouted loudest.
See how far a failure spreadsWalk the dependency graph. Node size is blast radius, a red ring is a single point of failure.
Resilience by business journey, not by serverScore what the business cares about: the journey, and every system underneath it, column by column.
A ranked, traceable planEvery finding walks back to a system, a field and a threshold, sized by effort and tagged to an owner.
Board-ready in one clickThe headline, the dimensions and the narrative, as a report you can take straight to a committee.
Screens show a synthetic demonstration estate, not a client engagement.
Get started

Start with data you already produce.
Leave with a plan you can defend.

The quickest way to start is with the extracts your teams already produce. No agents to install and nothing to rebuild: we handle the mapping and the modelling, then walk you through your own estate, the risks inside it and the order to fix them. Live integration follows when you are ready.

Safe in production from day oneForge works from extracts, so nothing is installed in your estate and nothing touches production. Run it inside your own tenancy, or fully air-gapped, and your data stays within your boundary.
Defensible under scrutinyEvery number traces to a named asset, a field and a threshold, and the same inputs always produce the same answer. Take it to your board or your regulator with the working shown.
Coverage you can trustForge shows how much of your estate it actually assessed. Gaps read as not assessed rather than a false pass, so you know exactly which feeds are worth adding next.